

Paid Growth 10 min read
Fintech customer acquisition cost for remittance apps: why blended CAC misleads
Fintech customer acquisition cost for remittance apps: measure cost per first transfer, split blended CAC by corridor and calculate CAC payback properly.
On this page
Quick answer
Fintech customer acquisition cost is the total cost of acquiring one new paying user, divided by the number acquired. For a remittance app, the paying user is a verified sender who completes a funded first transfer, so CAC should be measured as cost per first transfer, split by paid and organic sources and by corridor, and judged against how quickly repeat transfers pay it back.
Key takeaways
- Cost per install is the cheapest-looking rung of the CAC stack and the least useful one.
- Measure cost per first transfer, fully loaded with verification costs, promotional rates and fees.
- Blended CAC mixes cheap brand and organic senders with expensive paid ones and hides the paid number.
- Split CAC by corridor, because payback differs sharply between routes.
- CAC payback depends on send frequency as much as on acquisition cost.
"Our cost per install looks fine but we are losing money." Founders of remittance apps say this after a quarter of growing spend. The install number is steady. The board deck shows a blended CAC that looks reasonable. Cash says otherwise.
The problem is rarely the media buying alone. It is the definition. Fintech customer acquisition cost for a remittance app has to be measured at the point where money starts to flow, and most dashboards stop 3 steps earlier.
This guide covers the full CAC stack, the difference between blended, paid and corridor CAC, and how to calculate payback with send frequency included. It goes further than our earlier piece, Your cost per install is lying to you, which dealt with the install metric alone.
What fintech customer acquisition cost means for a remittance app
Customer acquisition cost is total acquisition spend in a period divided by the new paying users acquired in that period. The formula is generic. The 2 inputs are where remittance differs.
The denominator is funded first transfers, not installs, registrations or verified accounts. A sender who verifies and never funds has cost you money and earned nothing.
The numerator should include everything you spent to produce those first transfers:
- Paid media across every channel.
- Creative production and agency or freelancer fees.
- Referral rewards and first-transfer promotional rates, including any FX subsidy.
- Verification costs for every applicant, including those who failed or abandoned.
- Agent commission on first sends, for agent-led operators.
- Tools used mainly for acquisition, such as the MMP.
Leave out the fully loaded cost and CAC will look healthy while cash drains.
What should stay out of CAC?
Costs that serve existing senders belong elsewhere: lifecycle messaging to active senders, support after the first transfer, and retention offers. So do platform costs that would exist without any acquisition, such as the core transfer platform. Mixing them in makes CAC look worse and hides the retention budget, which is the budget that shortens payback.
The grey areas are brand campaigns and referral rewards. Keep brand in blended CAC, but out of the paid CAC you use for prospecting decisions. Count the referrer's reward as acquisition cost for the new sender, because it would not be paid otherwise.
The CAC stack: from cost per install to cost per first transfer
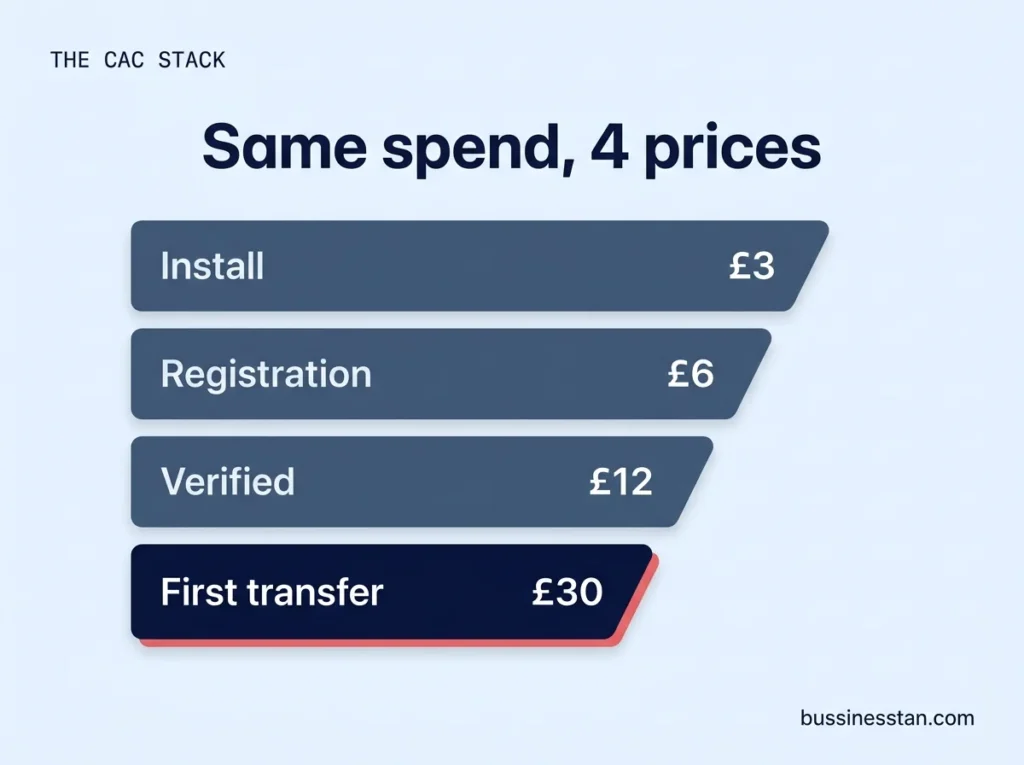
The CAC stack is the same spend divided by each step of the funnel. It shows where the money goes and which rung your dashboard is quietly reporting.
Why does cost per first transfer matter more than cost per install?
Because installs and first transfers do not move together. A cheaper audience can lower cost per install while lowering the verification rate faster, so each first transfer costs more. The platform reports a win. The business pays for a loss. Bidding and reporting both need to sit on the fourth rung, or on a post-KYC event where first transfers are too few to learn from.
The 3 middle rungs still matter as diagnostics. A falling install-to-registration rate points at the store listing or onboarding. A falling registration-to-verified rate points at the KYC screen. A falling verified-to-funded rate points at pricing, pay-in or the first-transfer experience.
Licensing and AML questions go to a qualified adviser. We handle advertising and marketing compliance.
Blended CAC vs paid CAC vs corridor CAC
Blended CAC divides all acquisition cost by all new senders, including those from brand search, organic search, referral and word of mouth. It is useful for the business plan. It is dangerous for budget decisions.
| Measure | Formula | Use it for | Blind spot |
|---|---|---|---|
| Blended CAC | All acquisition cost ÷ all first transfers | Business plan, investor reporting | Organic and brand senders flatter paid performance |
| Paid CAC | Paid acquisition cost ÷ paid-attributed first transfers | Channel budget decisions | Depends on attribution quality |
| Corridor CAC | Cost per first transfer by send and receive route | Where the next pound goes | Needs corridor-level tracking |
| Channel CAC | Cost per first transfer by channel and campaign | Optimisation inside a channel | Platform claims overlap |
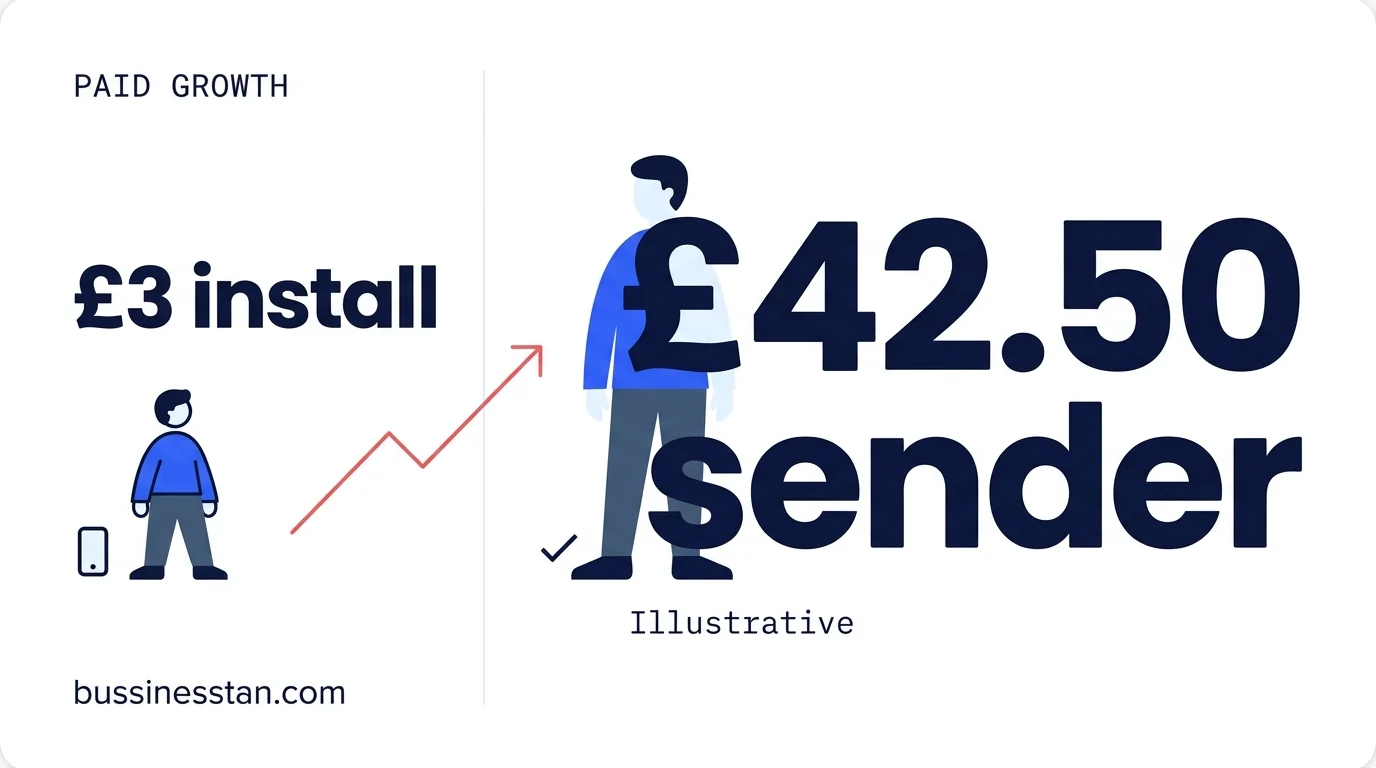
Continue the illustrative example. Add 1,500 organic and referral first transfers that cost £5,000 in content and referral work. Blended CAC becomes £47,500 divided by 2,500, which is £19. Paid CAC is still £42.50. A board that sees £19 approves more paid spend, and every extra pound buys senders at more than twice that figure.
Why does blended CAC mislead more as you grow?
Paid spend usually grows faster than organic demand. As the paid share rises, blended CAC drifts up slowly while paid CAC may already be well above what a sender is worth. The blended figure lags the problem by months.
How does CAC work for agent-led operators?
Agent-led operators acquire many senders at the counter, where the cost is agent commission, local promotion and staff time rather than media. Treat the agent network as a channel with its own CAC: first-send commission and local marketing divided by first transfers recorded against that agent code. Read it by branch as well as by corridor.
Corridor CAC adds the second correction. Corridors with the same paid CAC can have very different margin and send frequency, which is why the money transfer business model should be read per corridor per sender.
CAC payback with send frequency
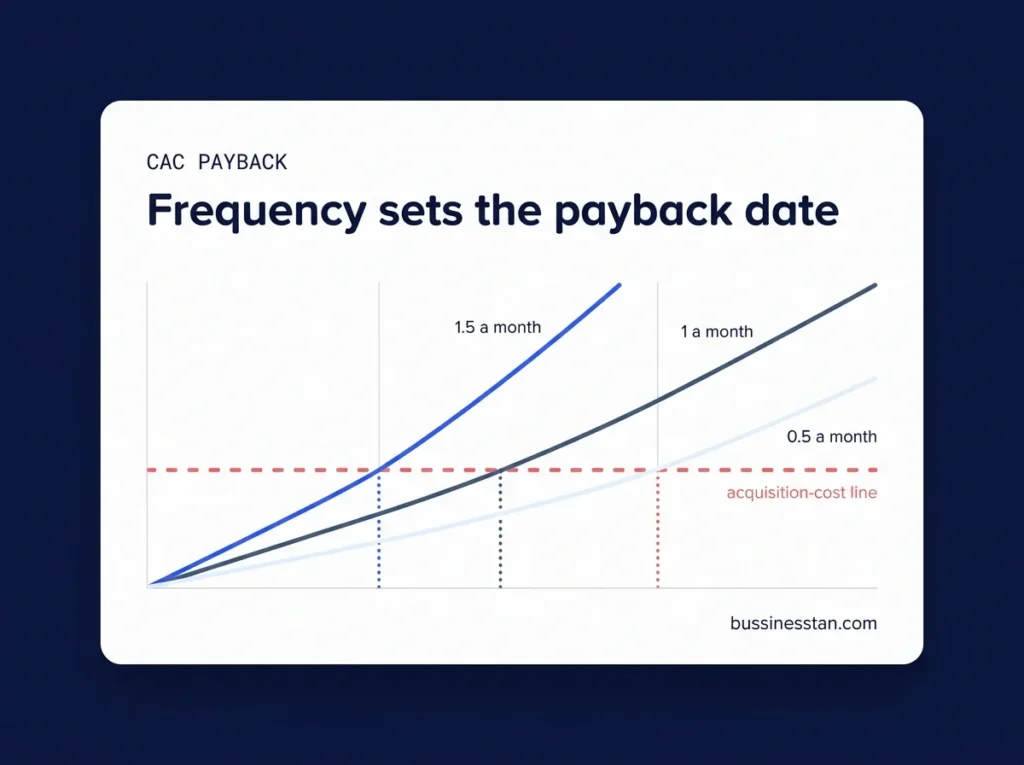
CAC payback is the number of months it takes a new sender's contribution to repay the cost of acquiring them. For remittance, send frequency drives it as much as acquisition cost does.
A simple version:
CAC payback months = cost per first transfer ÷ (contribution per transfer × transfers per sender per month)
This ignores churn and discounting, so treat it as a floor, not a forecast. Cohort data gives the real curve.
| Scenario (illustrative) | Cost per first transfer | Contribution per transfer | Transfers per month | Payback |
|---|---|---|---|---|
| Frequent sender | £42.50 | £4 | 1.5 | About 7 months |
| Monthly sender | £42.50 | £4 | 1.0 | About 11 months |
| Occasional sender | £42.50 | £4 | 0.5 | About 21 months |
The same acquisition cost produces 3 very different businesses. That is why lifecycle work that lifts send frequency often shortens payback faster than cutting media cost, a point we cover in Send frequency, not signups.
The CAC reporting checklist
Use this 6-point check before CAC goes into a board pack.
- Denominator is funded first transfers, taken from your transfer records.
- Numerator is fully loaded, with verification, promotional rates, fees and tools included.
- Paid and blended are shown side by side, never blended alone.
- Every figure is split by corridor, with the top 3 corridors shown individually.
- Platform claims are reconciled, with the gap between platform-reported and ledger first transfers stated. Our guide to analytics event tracking for remittance apps shows how.
- Payback is shown with send frequency, by monthly cohort.
If you cannot tick points 1, 4 and 5, fix measurement before moving budget. Our app install and user acquisition team reports on verified senders only, and a paid ads audit reads your accounts against your transfer records in 2 weeks.
Frequently asked questions
What is customer acquisition cost in fintech?
Customer acquisition cost is total acquisition spend divided by the number of new paying users in the same period. In fintech the definition of a paying user matters. For a remittance app it is a sender who completes a funded first transfer, not an install or an opened account, and the spend should include verification and promotional costs.
How do you calculate cost per first transfer?
Add paid media, creative, fees, referral rewards, promotional rates, verification checks and acquisition tools for a period. Divide by the funded first transfers in the same period, taken from your transfer records rather than ad platforms. Calculate it for paid sources separately and for each corridor, so budget decisions use the right figure.
Is blended CAC ever the right number?
Yes, for the business plan and for investor conversations about overall efficiency. It is the wrong number for deciding paid budgets, because cheap organic and brand senders hide the true cost of paid ones. Always show paid CAC and corridor CAC next to it.
What is a good CAC payback period for a remittance app?
There is no universal benchmark, and published fintech averages rarely separate remittance from lending or banking. Set your own target from cash position and cohort retention, then compare corridors against it. Many operators find payback varies more between corridors than between channels, which makes the corridor split the first fix.
Why is my CAC rising while cost per install is falling?
Usually because cheaper installs come from audiences that verify and fund less often. The platform optimises toward the event you send it, so if that event is an install or registration it will find cheaper, weaker users. Move the optimisation event to a post-KYC event or first transfer and judge results on cost per first transfer.
Where to start
Rebuild CAC from the ledger up: funded first transfers as the denominator, fully loaded costs as the numerator, split by paid, blended and corridor, with payback that includes send frequency. It is a less flattering number. It is the one your cash already follows.
Start with the calculator. If the figures disagree with your dashboards, the paid growth services team can show where the gap comes from. To see cost per first send by corridor across every channel, Book a Growth Audit: 2 weeks, a fixed fee, and a roadmap you keep.

Written by
Founder & CEO, Bussinesstan
Owns the commercial side of every engagement: fixed-fee scoping, corridor economics, and the reporting that ties spend to completed first transfers rather than to installs.
Meet the team
Google Ads for money transfer companies: structure the account by corridor
Google Ads for money transfer companies, structured by corridor: brand defence, intent groups, post-KYC imports and a sample account you can copy.
Meta ads for remittance apps: optimise for the first transfer, not the install
Meta ads for remittance apps that optimise for first transfers: Conversions API, event ranking, diaspora targeting and retargeting for KYC abandoners.
CRM for money transfer companies: design the data model first
CRM for money transfer companies, built on the data model: one record per sender, 9 lifecycle stages, B2B pipelines, consent rules and a 10-week rollout.