

Consulting 10 min read
Remittance corridor analysis: how to score a corridor before you spend
Remittance corridor analysis with a seven-dimension scorecard: demand, competition, pricing, payout, channels, economics and fit, graded before spend.
On this page
Quick answer
Remittance corridor analysis is the structured assessment of a send country and receive country pair before committing budget. A practical method scores each corridor on 7 dimensions: demand, competition, pricing visibility, payout reliability, channel opportunity, marketing economics and strategic fit. The weighted score places the corridor in one of 4 grades: priority, test, monitor or low priority. Regulatory and licensing fit is assessed separately by qualified advisers.
Key takeaways
- Remittance corridor analysis replaces "a spreadsheet and a strong opinion" with a scored, dated view of each corridor.
- Score 7 dimensions, weight them to your strategy, and grade every corridor on one scale.
- Market size alone is a poor guide; a large corridor with discounting competitors can be the worst place to spend.
- Every price you record needs a capture date, because corridor pricing moves.
- Regulatory and licensing questions sit outside the scorecard and go to qualified advisers.
We do not know which corridor to focus on. Most operators have a shortlist. The shortlist was built from the founder's network, a competitor's press release and a board member's view, and every corridor on it looks equally promising in the planning deck.
Then budget gets split evenly across unequal corridors, and six months later one route carries the business while the others quietly cost money.
Remittance corridor analysis is how you avoid that. It is not a market-size figure copied into a slide. It is a scored comparison of the corridors you run and the ones you are considering, built so you can say why a corridor gets money and another does not.
What remittance corridor analysis covers, and what it does not
A corridor is a send country and receive country pair: UK to Ghana, Canada to India, UAE to Pakistan. Corridor market research asks commercial questions about that pair.
| In scope | Out of scope |
|---|---|
| How many senders there are and where they live | Whether you can hold the required licence |
| What competitors charge and how visibly | AML risk assessment of the corridor |
| Whether payout partners are reliable for the methods senders want | Legal opinions on market entry |
| Which channels reach the diaspora, and at what cost | Regulatory due diligence |
| Whether the corridor fits your product and network | Sanctions exposure analysis |
Licensing and AML questions go to a qualified adviser. We handle advertising and marketing compliance. A corridor that scores well commercially still needs that separate review before launch.
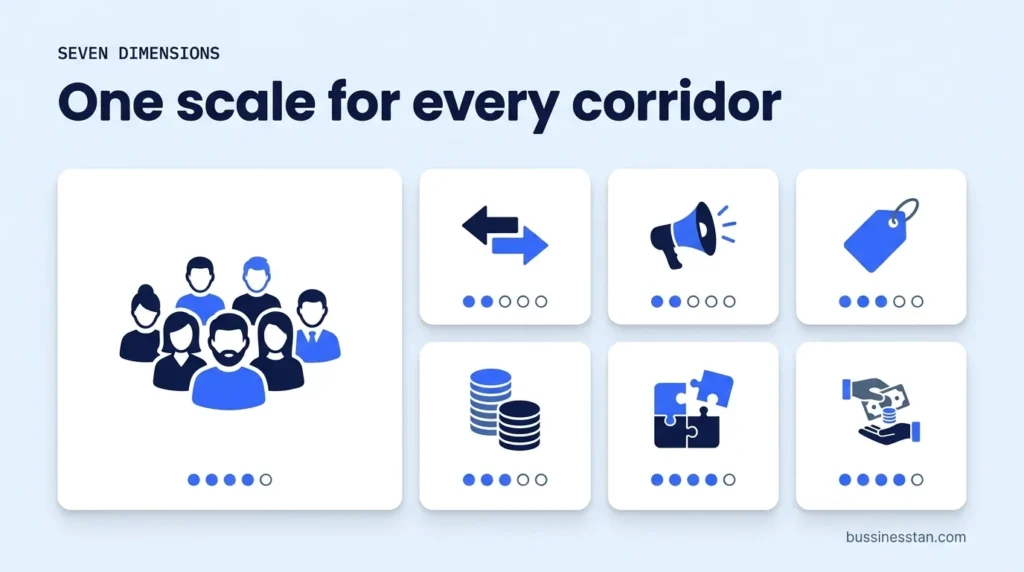
The seven-dimension corridor scorecard
Score each dimension from 1 (weak) to 5 (strong). The weights below are a sensible starting point for an app-led operator. Change them to match your strategy, but agree them before scoring, not after.
| Dimension | What you are asking | Starting weight |
|---|---|---|
| 1. Demand | How large and how concentrated is the sending diaspora, and how often do they send? | 20% |
| 2. Competition | How many operators serve the corridor, and are they discounting to win? | 15% |
| 3. Pricing visibility | Can senders easily compare prices here, and where would your price sit? | 10% |
| 4. Payout reliability | Do payout partners deliver reliably by bank, wallet and cash pickup? | 15% |
| 5. Channel opportunity | Can you reach senders through search, social, creators, community or agents at a sane cost? | 15% |
| 6. Marketing economics | Will corridor margin cover the likely cost per first send within an acceptable payback? | 15% |
| 7. Strategic fit | Does the corridor use your existing network, languages, partners and product? | 10% |
How do you score demand?
Demand is more than market size. Look at the size of the diaspora in your send country, how concentrated it is in cities you can reach, how often people send and the typical amount. A smaller, concentrated community in 2 cities can beat a larger, dispersed one.
How do you score competition and pricing visibility?
Count the operators actively marketing on the corridor, then capture their price for the same send amount on the same day: fee, exchange rate and what the beneficiary receives. Heavy discounting or zero-fee offers backed by large budgets lower the competition score. Pricing visibility asks a different question: if senders compare prices easily on this corridor, a weak price is exposed at once, and a strong one earns attention.
How do you score payout reliability?
Ask what payout methods senders in the receive country actually use, then check which partners can deliver them, at what speed, and how often transfers fail or need manual handling. A corridor with strong demand and a weak payout partner produces support tickets, not repeat senders.
How do you score marketing economics?
Estimate corridor margin per transfer from your fee and FX spread, then estimate cost per first send from channel benchmarks you trust. If the margin from the likely number of transfers per sender does not recover acquisition cost within your payback target, the corridor scores low, however large it is.
The four grades
Multiply each score by its weight and add them up. The total, out of 5, sets the grade.
| Weighted score | Grade | What it means for budget |
|---|---|---|
| 4.00 or above | Priority | Fund a full launch or scale-up plan |
| 3.30 to 3.99 | Test | Fund a capped test with a clear gate |
| 2.50 to 3.29 | Monitor | No spend now; re-score next quarter |
| Below 2.50 | Low priority | Remove from the shortlist for now |
Grades are a decision aid, not a verdict. Corridor prioritisation still needs judgement, but the argument is now about specific scores rather than instinct.
Where the data comes from
Good corridor market research uses public sources first, with the date each figure was captured.
| Dimension | Useful sources |
|---|---|
| Demand | World Bank and KNOMAD bilateral remittance estimates; national census country-of-birth data; your own sender records |
| Competition | Competitor websites and apps; public ad libraries; app store listings |
| Pricing visibility | World Bank Remittance Prices Worldwide; price captures from competitor calculators, dated |
| Payout reliability | Payout partner performance data; your own failure and manual-review rates |
| Channel opportunity | Search demand tools; social audience sizing; diaspora community groups and associations |
| Marketing economics | Your cost per first send by channel; your corridor margin; your repeat-send rates |
| Strategic fit | Your agent network, languages spoken by staff, partner contracts, product roadmap |
A note on remittance market sizing: the World Bank and KNOMAD bilateral estimates are modelled from bilateral migration stock data and reported remittance inflows, not counted transfers, and the World Bank notes caveats such as undercounting and reporting lags. They are useful for comparing corridors, less useful as a precise forecast. The World Bank's Remittance Prices Worldwide database, published quarterly, is the reference for corridor pricing and underpins monitoring of the UN target to bring average remittance costs below 3% by 2030.
Every price you record needs a capture date. Pricing quoted from memory is how corridor decisions go wrong.
Illustrative example: three corridors scored
| Dimension (weight) | Corridor A | Corridor B | Corridor C |
|---|---|---|---|
| Demand (20%) | 4 | 5 | 5 |
| Competition (15%) | 3 | 2 | 3 |
| Pricing visibility (10%) | 4 | 3 | 4 |
| Payout reliability (15%) | 4 | 4 | 4 |
| Channel opportunity (15%) | 4 | 3 | 4 |
| Marketing economics (15%) | 3 | 2 | 4 |
| Strategic fit (10%) | 4 | 3 | 5 |
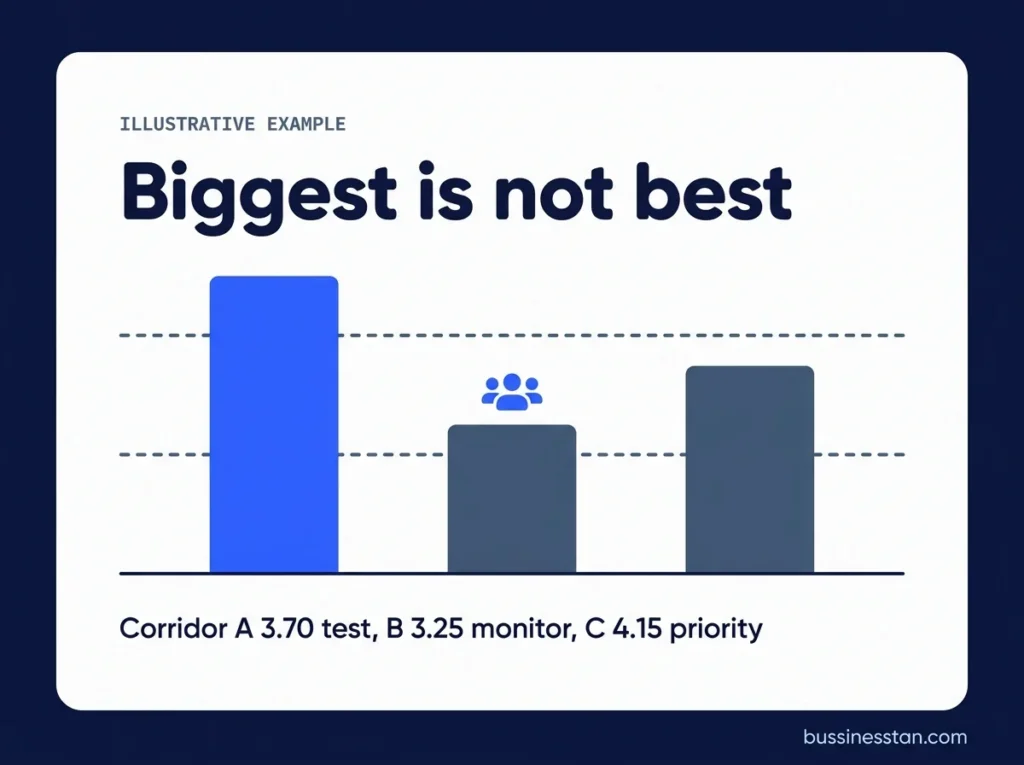
| Weighted score | 3.70 | 3.25 | 4.15 |
| Grade | Test | Monitor | Priority |
Corridor B has the biggest demand score and still grades Monitor, because heavy discounting and poor economics outweigh size. Corridor C becomes the launch candidate, subject to the separate regulatory review. Corridor A gets a capped test with a gate: a target cost per first send over the first 90 days.
How to run the analysis in five steps
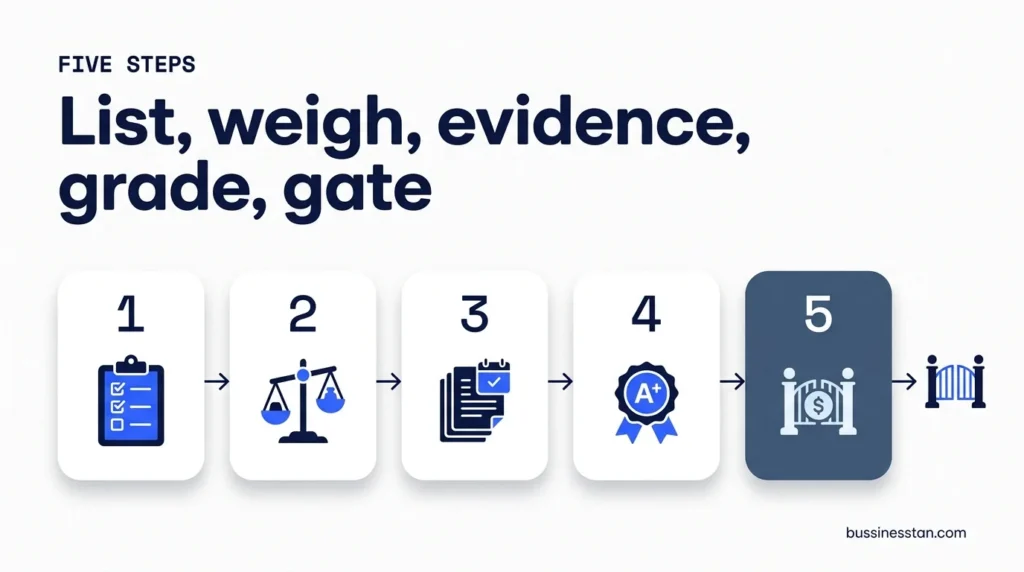
- List the corridors. Include live corridors as well as candidates, so you can compare like with like.
- Agree weights. Leadership signs off the weights before any scoring starts.
- Gather and date the evidence. One sheet per corridor, every figure with a source and capture date.
- Score and grade. Two people score independently, then reconcile differences with evidence.
- Set the gates. Each Priority or Test corridor gets a budget cap, a metric and a review date.
Once a corridor is graded Priority, the question changes from which corridor to launch to how. Our guide to launching a new remittance corridor in 90 days covers the phases, and our new corridor launch work turns a graded corridor into a sequenced plan.
Corridor concentration is one of the growth problems covered in the five cross-border payments challenges that stall remittance growth. This scorecard is the first fix for it.
This is the method behind our corridor market research: 7 dimensions, 4 grades, every price time-stamped, regulatory work referred out.
Frequently asked questions
What is corridor market research?
Corridor market research is the commercial study of a send and receive country pair: sender demand, competitors, pricing, payout options, channels and likely acquisition economics. It produces a graded view of each corridor so budget follows evidence. It does not replace licensing analysis, AML assessment or legal advice, which need qualified specialists.
How do you do remittance market sizing for a corridor?
Start with bilateral remittance estimates from the World Bank and KNOMAD, then narrow using diaspora population data for the cities you can reach and your own sender records. Treat modelled estimates as comparative, not exact. Record the source and date for each figure, and size the reachable market rather than the whole corridor.
How do I decide which corridor to launch?
Score every candidate on the same 7 dimensions with agreed weights, then grade them. Launch the highest-graded corridor that also clears regulatory review with your advisers. Give Test corridors a capped budget and a gate. Avoid choosing on market size alone, since discounting competitors can make a large corridor unprofitable.
What weights should I use for corridor prioritisation?
A common starting point is 20% demand and 10% to 15% for each of the other 6 dimensions. App-led operators often raise channel opportunity and marketing economics. Agent-led operators often raise strategic fit and payout reliability. Agree the weights before scoring so the result is not reverse-engineered.
How often should corridors be re-scored?
Re-score quarterly, or sooner when a competitor changes price, a payout partner changes terms or your own cost per first send moves sharply. Pricing captures in particular go stale quickly. Corridors graded Monitor should always be re-scored at the next quarterly review.
Where to start
List every corridor you run or are considering. Agree the weights with leadership. Then score them honestly, with dated evidence, and let the grades decide where the next pound goes.
For a scored corridor report, see our corridor market research. If you are not sure corridor mix is the real problem, Book a Growth Audit. It includes cost per first send by corridor, runs for two weeks at a fixed fee, and you keep the roadmap whether or not the work continues.

Written by
Founder & CEO, Bussinesstan
Owns the commercial side of every engagement: fixed-fee scoping, corridor economics, and the reporting that ties spend to completed first transfers rather than to installs.
Meet the team
Website audit checklist for money transfer companies
A website audit checklist for money transfer companies: technical, SEO, conversion, trust and tracking checks, scored and ranked by first transfers.
Stablecoin cross border payments: what money transfer operators should plan for
Stablecoin cross border payments explained for remittance operators: what the rails change, what they do not, and the questions to ask a payout partner.

What a paid ads audit for a remittance company should find in 14 days
What a paid ads audit for a remittance company should find in 14 days: 18 areas, the timeline, the deliverables and when the answer is spend less.