

Consulting 10 min read
The money transfer business model: fees, FX spread and corridor margin
The money transfer business model explained: fee and FX revenue, payout and acquisition costs, and why margin per corridor per sender is the number to run.

On this page
Quick answer
The money transfer business model earns revenue from 2 main sources on each transfer: the fee charged to the sender and the FX spread, which is the gap between the rate the operator obtains and the rate it gives the sender. Costs include pay-in and payout partner fees, acquisition, verification, support and fraud losses. Profit depends on margin per corridor per sender over time, not on volume alone.
Key takeaways
- Revenue per transfer is the fee plus the FX spread, and in many corridors the spread carries more of it than the fee.
- Payout partner fees, pay-in costs, verification and support decide how much of that revenue survives.
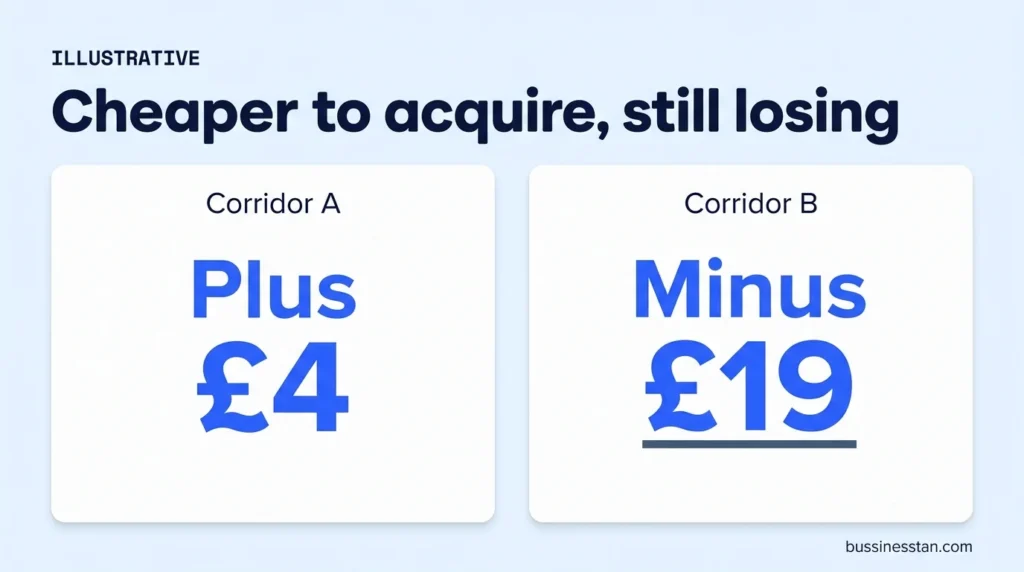
- A corridor with cheap acquisition can still lose money if senders send rarely or in small amounts.
- The unit to manage is margin per corridor per sender over 12 months, net of what it cost to acquire them.
- Growth spend should follow corridor margin, which most operators cannot yet report.
"Spend rises but nobody can say which corridors actually make money." Founders say it quietly, usually after a board meeting. Volume is up, the paid budget is up, and the finance team still produces one blended margin figure for the whole business.
That figure hides the answer. The money transfer business model is simple on paper: take a fee, keep a spread, pay your partners. In practice every corridor has its own fee, spread, partner cost and sender behaviour, so the same marketing pound can build profit on one route and burn it on another.
This guide breaks the model into its revenue and cost lines, then shows how to read it corridor by corridor. If you are pre-launch, it is the arithmetic to settle before you set a marketing budget.
What the money transfer business model is
A money transfer operator collects money from a sender in one country and pays it to a beneficiary in another. It earns on the difference between what the sender pays and what the route costs to run.
That difference is created on each transfer but earned across a sender's lifetime. One transfer rarely covers what it cost to find, verify and support a new sender. A later one often does. That is why send frequency sits at the centre of the model, as we set out in Send frequency, not signups.
How do money transfer companies make money
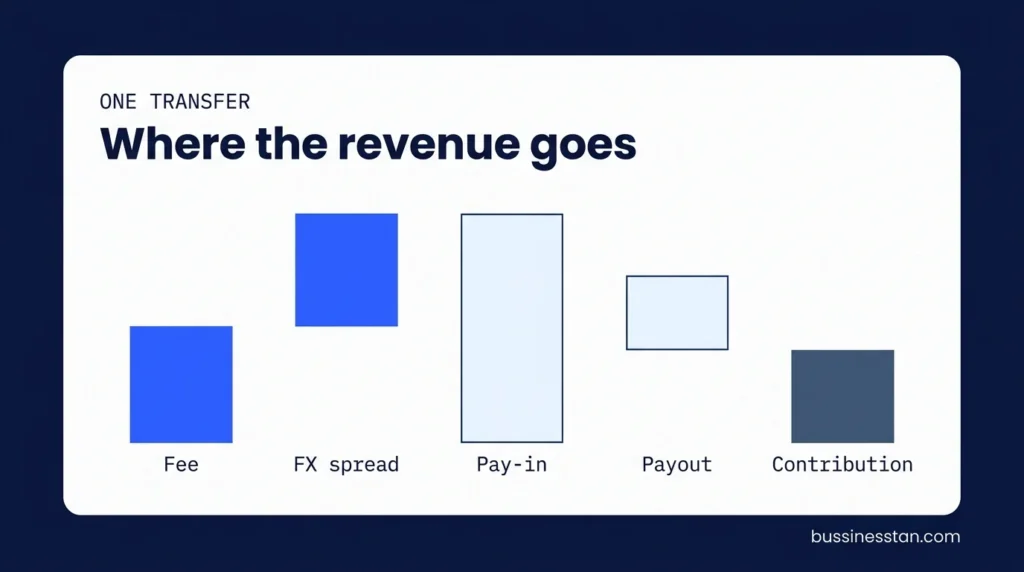
Most operators earn from some mix of 5 revenue lines. The weight of each varies by corridor, pricing strategy and business type.
| Revenue line | What it is | Where it matters most |
|---|---|---|
| Transfer fee | A flat or tiered charge per transfer | Low-value, high-frequency corridors |
| FX spread | The margin between the operator's cost of currency and the rate shown to the sender | Most consumer corridors, especially where "zero fee" is advertised |
| Float | Value earned on funds held between collection and payout, where permitted | Businesses with meaningful balances and settlement delays |
| Partner economics | Volume tiers, rebates or revenue shares agreed with payout or pay-in partners | Operators with scale in a corridor |
| B2B and API fees | Charges to businesses, platforms or other operators using your rails | Payout platforms and white-label providers |
What is the FX spread?
The FX spread is the difference between the exchange rate an operator obtains and the rate it offers the sender, applied to the send amount. On a £300 transfer, a 1% spread is worth £3 before costs. It is often the larger revenue line, and it is the one senders compare on a rate board or comparison site. Price it by corridor, not as one global margin.
Is float a real revenue line?
For some operators, yes, but it is constrained. Whether and how you can earn on funds you hold depends on your safeguarding arrangements and licence conditions.
Licensing and AML questions go to a qualified adviser. We handle advertising and marketing compliance.
The cost lines that decide margin
Revenue is visible on every transfer. Several costs are not, which is why blended margin misleads.
| Cost line | Per transfer or per sender | Notes |
|---|---|---|
| Pay-in cost | Per transfer | Card, bank transfer and open banking carry different costs |
| Payout partner fee | Per transfer | Differs by payout method: bank deposit, mobile wallet, cash pickup |
| Treasury and funding cost | Per transfer | Pre-funding a payout partner ties up cash |
| Acquisition | Per new sender | Paid media, referral rewards, promotional rates, agent commission |
| Verification | Per applicant | KYC checks are paid for applicants who never send too |
| Support | Per sender | "Where is my money" contacts cluster in the first transfers |
| Fraud and failed payments | Per transfer | Chargebacks, returns and write-offs |
| Agent commission | Per transfer | Agent-led operators pay the counter on each send |
New teams are often surprised by 2 of these. Verification is paid on every applicant, including those who drop at the KYC screen, so a leaky onboarding funnel raises the real cost of each sender. Support is front-loaded, so a new sender costs more to serve in month 1 than in month 6.
Corridor margin: the unit that matters
Corridor margin is the revenue a corridor produces minus the direct costs of running it, including acquiring the senders who use it. Read it per sender, over a fixed period, and the model becomes manageable.
The corridor margin stack
We use a 5-line stack to read any corridor. It fits on one page and it forces the conversation away from volume.
- Revenue per transfer: fee plus FX spread.
- Contribution per transfer: revenue minus pay-in, payout and fraud costs.
- Transfers per sender, first 12 months: from cohort data, not an assumption.
- Servicing cost per sender: verification and support.
- Cost per first transfer: acquisition spend divided by funded first transfers, by corridor.
Corridor margin per sender equals line 2 times line 3, minus line 4, minus line 5.
Money transfer business profit margin: what moves it
Money transfer business profit margin moves on 5 levers. Only 2 of them belong to marketing, which is why growth teams and finance teams need the same corridor view.
- Send frequency. The biggest lever in most models. Lifecycle messaging, rate alerts and timing around paydays and occasions such as Eid move it.
- Corridor mix. Shifting new senders toward corridors with healthier margin changes the whole business, even at flat volume.
- Pay-in method. Nudging senders toward cheaper pay-in methods raises contribution per transfer.
- Payout routing. Partner choice and method mix change cost per transfer. This is an operations and treasury decision.
- Acquisition efficiency. Cost per first transfer by corridor, measured on funded senders rather than installs. Our app install and user acquisition work reports on verified senders for exactly this reason.
Before adding a corridor, test it on the same stack. Our corridor and market research grades each route on demand, competition, pricing visibility and marketing economics, and refers regulatory fit to specialists.
Where growth spend breaks the model
Growth spend breaks the model in a predictable way. Budget is set on blended cost per install or cost per registration. The platforms find the cheapest senders, who cluster in the corridors with the thinnest margin or the lowest send frequency. Volume rises, blended margin falls, and nobody can say why.
The fix is sequencing. Measure corridor margin first. Set a ceiling on cost per first transfer per corridor from that margin. Then let spend follow the corridors that pay back inside your target period. If you are building the plan before launch, how to start a money transfer business covers the order of work, and our guide to Google Ads for money transfer companies shows how to split search budget by corridor.
We argue against more spend until the corridor numbers hold. It makes month one slower. It avoids a year of scaling the wrong route.
Frequently asked questions
How do money transfer companies make money?
Mainly from the transfer fee and the FX spread on each transfer. Some also earn from float, where their arrangements allow it, from partner volume deals, and from B2B or API fees. The profit comes from repeat transfers, because the first transfer rarely covers the cost of acquiring, verifying and supporting a new sender.
What is a typical money transfer business profit margin?
There is no reliable single figure, and published averages hide wide differences between corridors, pay-in methods and business types. A more useful measure is your own corridor margin per sender over 12 months. Build it from your transfer records, partner invoices and acquisition spend, then compare corridors against each other.
Is the FX spread more important than the fee?
In many consumer corridors, yes. Operators that advertise low or zero fees usually earn mainly through the FX spread. Senders increasingly compare the total amount received, so the spread has to be priced corridor by corridor against the rates your competitors show, not set once for the whole business.
How is corridor margin calculated?
Take contribution per transfer (fee plus spread, minus pay-in, payout and fraud costs), multiply by transfers per sender over a fixed period, then subtract servicing costs and cost per first transfer. Run it separately for each send and receive route. The result shows which corridors deserve the next marketing pound.
Does the business model differ for agent-led operators?
The revenue lines are the same, but agent commission becomes a major cost per transfer, and acquisition often happens at the counter rather than through paid media. Agent-led operators should add commission and branch costs to the stack and read corridor margin by location as well as by route.
Where to start
The model has 2 revenue lines that matter and a longer list of costs that decide what you keep. Read it per corridor and per sender, over 12 months, and most budget arguments settle themselves.
Start with the calculator above and your last 6 months of transfer records. If the numbers disagree with what your ad platforms say, or you cannot split them by corridor, that gap is the first finding. Our consulting services exist to close it. Book a Growth Audit for a fixed-fee, 2-week view of cost per first send by corridor and send frequency by cohort.

Written by
Founder & CEO, Bussinesstan
Owns the commercial side of every engagement: fixed-fee scoping, corridor economics, and the reporting that ties spend to completed first transfers rather than to installs.
Meet the team
Remittance corridor analysis: how to score a corridor before you spend
Remittance corridor analysis with a seven-dimension scorecard: demand, competition, pricing, payout, channels, economics and fit, graded before spend.

Website audit checklist for money transfer companies
A website audit checklist for money transfer companies: technical, SEO, conversion, trust and tracking checks, scored and ranked by first transfers.
Stablecoin cross border payments: what money transfer operators should plan for
Stablecoin cross border payments explained for remittance operators: what the rails change, what they do not, and the questions to ask a payout partner.